> ## Documentation Index
> Fetch the complete documentation index at: https://docs.getlimina.ai/llms.txt
> Use this file to discover all available pages before exploring further.
# Logstash & Dashboards
> How to integration Limina with elastic search for monitoring.
## Reporting Integration
The Limina container can be configured to send reporting metrics to a logstash server. To enable this feature, the following environment variables can be added to the docker run command:
| Variable Name | Description |
| -------------------------- | ------------------------------------------------------------------------------------------------------------------------------------------------------------- |
| `PAI_ENABLE_REPORTING` | Enables Reporting to a Logstash Server |
| `LOGSTASH_HOST` | The Logstash server's host info |
| `LOGSTASH_PORT` | The port of the Logstash server |
| `LOGSTASH_MONITORING_PORT` | The monitoring API port of the Logstash server. |
| `LOGSTASH_TTL` | Sets the time to live value (in seconds) of the data queued for logstash. Data will be lost if the queued data is not sent successfully before the ttl value. |
| `PAI_REPORT_ENTITY_COUNT` | Enables entity counts (per piece of text deidentified) to be added to reporting |
To run a container with these settings, the following command can be used:
```shell Docker Command wrap theme={"theme":"poimandres"}
docker run --rm -p 8080:8080 --mount type=bind,src=$PWD/tests/fixtures/licenses/license.json,dst=/app/license/license.json -e PAI_ENABLE_REPORTING=true -e LOGSTASH_HOST=http://hostname.org -e LOGSTASH_PORT=50000 -e PAI_REPORT_ENTITY_COUNTS=true -it deid:image-name
```
The Logstash pipeline that the data is being sent to must be configured to able to accept JSON objects. A sample pipeline configuration that allows this would be:
```ruby Pipline Config theme={"theme":"poimandres"}
input {
tcp {
port => 50000
codec => json_lines {}
}
}
output {
elasticsearch {
hosts => "elasticsearch:9200"
user => "${LOGSTASH_USER}"
password => "${LOGSTASH_PASSWORD}"
}
}
```
### What is Being Sent?
When `PAI_ENABLE_REPORTING` is enabled in the container metering records will be sent to Logstash in batches, at 5 minute intervals. All records include the following fields:
| Field Name | Description |
| --------------------- | ---------------------------------------------------------------------- |
| `privateai.SessionId` | A unique id that relates all metering information sent in the interval |
| `privateai.Accuracy` | The accuracy used in the requests |
| `privateai.ProjectId` | The project id of the request (the default value is main) |
| `privateai.Synthetic` | Boolean value indicating if synthetic data was used |
The following meters are currently being used (one record per meter, per project ID):
| Field Name | Description |
| --------------------- | -------------------------------------------------- |
| `privateai.api_calls` | The amount of api calls sent in the interval |
| `privateai.api_chars` | The amount of characters processed in the interval |
| `privateai.api_words` | The amount of words processed in the interval |
If `PAI_ENABLE_PII_COUNT_METERING` is enabled in the container, meters for each entity found will also be sent. These meters contain the following fields:
| Field Name | Description |
| --------------------- | ----------------------------------------------------------------------------- |
| `privateai.pii-count` | The amount of times the entity was found to be the best label in the interval |
If `PAI_REPORT_ENTITY_COUNTS` is enabled in the container, a record of the entities found and their counts for each unit of text processed will be sent. e.g.
```text Metering Records theme={"theme":"poimandres"}
privateai.NAME: 2
privateai.OCCUPATION: 1
```
would indicate that in a unit of text processed, the entity NAME was the best label two times, and OCCUPATION was the best label once.
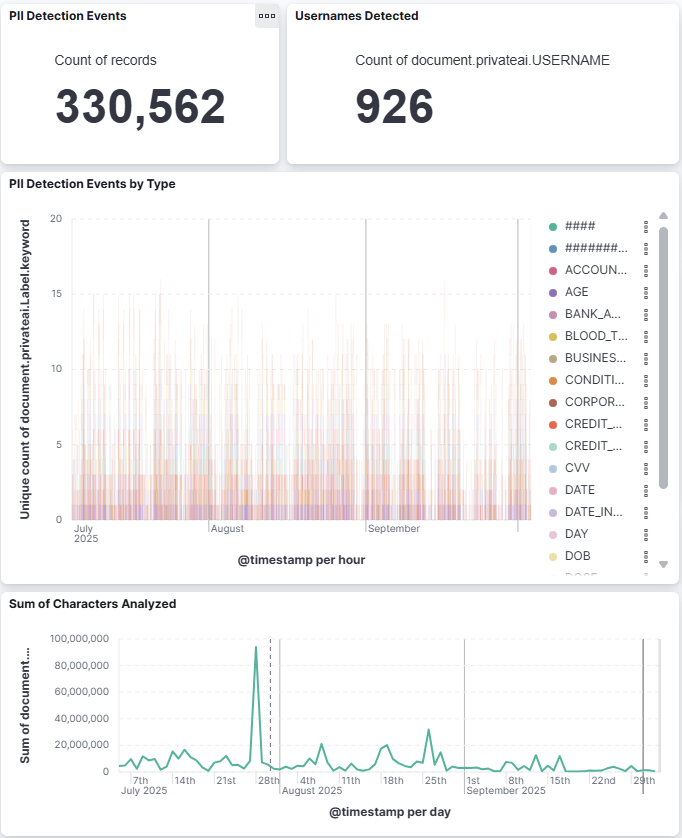 ### Reading Output
The following sections describe the typical field lists used when logs are forwarded to the Logstash server within the environment. These examples are provided as a reference for log analysis and field mapping configuration. It contains Limina internal debug information.
### Reading Output
The following sections describe the typical field lists used when logs are forwarded to the Logstash server within the environment. These examples are provided as a reference for log analysis and field mapping configuration. It contains Limina internal debug information.
| Field Name | privateai Field | Example | Description |
| ------------ | ------------------------ | ---------------------------------------------------------- | ---------------------------------------------------------- |
| `@version` | | 1 | Logstash internal version # 1 |
| `message` | | Sending data to logstash | Log description. Limina set this. |
| `type` | | python-logstash | Name of logging handler |
| `level` | | INFO | Log level |
| `host` | | 471d716d6192 | Host (container) to send logs |
| `pid` | | 25 | Uvicorn process pid |
| `program` | | /opt/venv/lib/python3.10/site-packages/uvicorn/**main**.py | Uvicorn location |
| `@timestamp` | | 2026-03-31T10:44:22.291Z | Log time stamp |
| `logsource` | | 471d716d6192 | Log source (equivalent to Host) |
| `privateai` | | | Limina specisic section |
| | `api-calls` | 3 | Number of Api call |
| | `api-chars` | 1234 | Number of characters processed |
| | `api-words` | 25 | Number of words processed |
| | `logger_name` | logstash | Name of logger |
| | `Relext` | false | Relation extraction(beta) used? |
| | `line` | 208 | Report function location |
| | `logstash_async_version` | 3.0.0 | logstash async handler version |
| | `ProjectId` | mytest\_prj1 | Project Id name provided by user |
| | `thread_name` | ThreadPoolExecutor-1\_2 | Thread name of processing |
| | `RecordType` | `meter` or `entities` | logstash record type |
| | `Accuracy` | high\_multilingual | Limina model name used |
| | `path` | /app/base\_metering.py | Usage report file name |
| | `interpreter_version` | 3.10.20 | Limina container's python version |
| | `Synthetic` | false | Synthetic data used? |
| | `AppVersion` | 4.3.0-cpu | Limina container version |
| | `func_name` | report | Function name of usage reporting |
| | `interpreter` | /opt/venv/bin/python | Python path inside container |
| | `process_name` | MainProcess | Process name for the pid |
| | `SessionId` | 440c5885-f5dd-40ee-abce-5d6a98772f99 | Session Id of sending logs |
| | `Coref` | false | Coreference used? |
| | `LicenseId` | 412 | Limina license file Id |
| | `ApiRoute` | process\_files\_uri | Limina Api name called |
| | `TotalEntities` | 2 | Number of redacted entity types |
| | `@TimeOfRequest` | 2026-04-02T17:18:29.662365 | Time stamp of TotalEntities logged |
| | `[Name of Entity]` | 2 | Count of specific entity |
| | `pii-count` | 1 | Count of specific entity (When TotalEntities not selected) |